


Gold and oil prices have seen a significant surge recently due to escalating tensions in the Middle East. The increase in tensions began during the US session yesterday with airstrikes in Lebanon and Tehran targeting a senior Hamas leader. These events have fueled safe haven demand and set the stage for further geopolitical uncertainties.
As Iran’s incoming President is expected to respond to these events, world leaders are calling for calm to prevent regional spillover. However, hopes for a ceasefire may be overshadowed by the looming FOMC meeting and the potential for further escalation in tensions.
Despite benefiting from safe haven demand, the US dollar has faced challenges this morning, possibly due to market apprehension ahead of the FOMC meeting. This uncertainty has also affected oil prices, with Brent crude finding support around the 78.00 handle and trading at 80.82 a barrel.
The daily close below the 80.00 mark hinted at potential downside for Brent crude, but geopolitical risks have led to a rebound for now. Concerns around oil prices are mixed, with worries about depleted stockpiles balanced by growth concerns in China.
Looking ahead, the market will closely watch the US Energy Information Administration’s Crude Oil Stocks Change report and tomorrow’s OPEC+ meeting for guidance on oil output levels. Market participants hope for clarity from OPEC to shift attention towards supply risks stemming from Middle East conflicts.
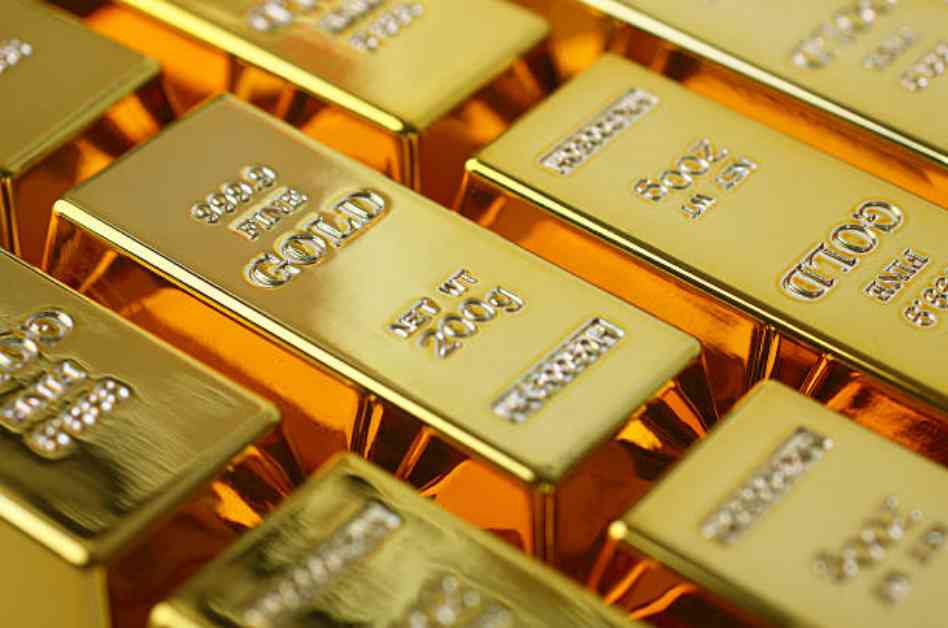
On the gold front, prices have broken a descending trendline and surpassed the 2481.00 level. The breakout has gained momentum without a retest of the trendline, with support at the 100-day moving average around 2405.00. Immediate resistance levels are at 2432 and 2450, with a potential move towards the previous highs at 2481.00.
As the FOMC meeting approaches, the market will be watching for further bullish momentum in gold prices. With the possibility of consolidation leading up to the meeting, investors will be monitoring geopolitical developments and their impact on both gold and oil prices.
Overall, the surge in gold and oil prices amid Middle East tensions highlights the importance of geopolitical risks in driving market movements. As investors navigate uncertainties in the region, staying informed and monitoring key events will be crucial for making informed trading decisions.


