-Risen Energy: Comparative map of global gains in power generation and technical analysis of different cell technologies
NINGBO, China, Oct. 24, 2022 /PRNewswire/ -- With the rapid development of photovoltaic technology from p-type to n-type, the difference in power generation of different cell technology products is drawing more and more attention. . Currently, the main cell technologies are PERC, TOPCon and HJT. Each of them has its own advantages and disadvantages, but comparative research on power generation still lacks a systematic comparison of the complete life cycle based on the perspective of global application scenarios.
To this end, Risen Energy Co., Ltd has compiled the main parameters of the above three technologies and measured the power generation of utility-scale power plants with these three different cellular technology panels over a life cycle of 25 years in 21 typical countries and regions with different climatic environments around the world to create a comparative map of global power generation gains.
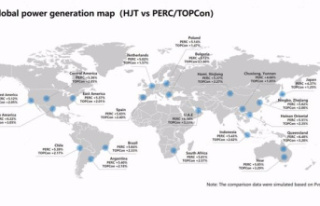
I. World Power Generation Gain Map ( HJT vs PERC/TOPCon )
Globally, products with HJT technology have higher power generation, which is 4.37% to 6.54% higher than PERC and 1.25% to 3.33% higher than TOPCon. and its power generation performance is more prominent especially in high temperature regions (e.g. Middle East, Australia and southern US), with an increase of 6% compared to PERC and 3% in comparison to PERC. comparison with TOPCon. As shown in figure 1.1.
Figure 1.1 Map of global power generation earnings
II. Technical analysis of the modules
According to the characteristics of the modules, the power generation difference between the different cell technologies in each region of the map is mainly due to three factors: the temperature coefficient, the bifacial factor and the power degradation, so the HJT modules can offer higher power generation gains and more stable power performance for the PV system thanks to its extremely stable temperature coefficient, higher bifacial factor and higher energy retention.
2.1 Extremely stable temperature coefficient
Compared to the power temperature coefficient of -0.35%/°C for PERC and -0.32%/°C for TOPCon, HJT modules have a more stable power temperature coefficient of -0.24% /°C, which means that HJT modules have less power degradation compared to PERC and TOPCon modules as module operating temperature increases, thus reducing power generation loss, and this advantage of Power generation will be especially in case of high temperature of the operating environment, as shown in Figure 2.1.
Figure 2.1 PERC/TOPCon/HJT correspondence curves between power and temperature
2.2 Mayor factor bifacial
With a naturally symmetrical structure, the HJT cell is inherently a bifacial cell and is the cell technology with the largest bifacial factor today, as shown in Figure 2.2. In the same application scenario, the higher the bifacial factor, the higher the rear power generation gain. The bifacial factor of HJT modules is around 85%, which is 15% more than PERC modules and about 5% more than TOPCon modules, as shown in Table 2.1.
Figure 2.2 Structure of the HJT cell
Table 2.1 Bifacial factor of PERC/TOPCon/HJT modules
In the same utility-scale ground-mounted power plant application scenario, the higher bifacial factor of HJT modules brings high power generation gain compared to that of PERC and TOPCon modules.
2.3 Greater energy retention
Based on the power degradation curves of the three different cell technologies, it is clear that at the end of year 25, the power retention rate of the HJT modules is 92%, while that of the PERC modules is 87.2% and that of the TOPCon modules is 89.4%. This means that HJT products retain power best throughout the lifecycle of commercial-scale power plants, which can lead to more stable and relatively higher power generation, as shown in Figure 2.3. .
Since the results mentioned above are calculated at the current 2% degradation in the first year, the power generation advantage will become more noticeable as improvements in cell and module encapsulation technology and materials can be achieved. lead to less degradation in the first year of HJT products.
Figure 2.3 PERC/TOPCon/HJT Modules Product Warranty
The above is a brief review of the performance of HJT cells and modules. However, what are the main factors that affect the power generation of the modules? What is the importance of the impact? Risen Energy has attempted to perform a more detailed analysis by PVSYST.
III. Analysis of PVSYST
As for the influencing factors for power generation, typical high and low temperature application scenarios, respectively, will be selected for analysis.
3.1 Low temperature application scenarios
Harbin is chosen as a typical example of a low temperature application scenario, which is located near 45.9°N with an annual mean temperature of 4.7°C and a total horizontal radiation of 1347 KWh/m2. The plant is designed with a DC/AC ratio of 1.25 and an installed capacity of 4MW (with slight variations on the actual design), using a fixed support with an optimal tilt angle and suitable string inverters. In year 25, TOPCon's power generation gain is 3.94% and HJT's is even higher at 7.73% compared to PERC's power generation, as shown in Table 3.1 .
Table 3.1 Comparison of PERC/TOPCon/HJT Power Generation Gain
Based on loss comparison, the most important factor affecting power generation in low temperature applications is power degradation. At the end of year 25, the power degradation is 12.86% (1.6% 11.26%) for PERC modules, 10.6% (0.6% 10%) for TOPCon modules and 7.87% (1.6% 6.27%) for HJT modules. See Figure 3.1.
Figure 3.1 Comparison of the main losses of PERC/TOPCon/HJT at low temperature
3.2 High temperature application scenarios
Abu Dhabi in the Middle East is chosen as a typical example of a high temperature application scenario, which is situated near 24.4°N with an annual mean temperature of 28.5°C and a total horizontal radiation of 2015.1 KWh. /m2. The plant is designed with a DC/AC ratio of 1.05 and an installed capacity of 4MW (with slight variations on the actual design), applying the optimal angle of inclination for the fixed support and suitable string inverters. In year 25, TOPCon's power generation gain is 4.52% and HJT's is even higher at 9.67% compared to PERC's power generation, as shown in Table 3.2 .
Table 3.2 Comparison of PERC/TOPCon/HJT Power Generation Gain
According to the loss comparison chart, in addition to power degradation, operating temperature loss is another important factor affecting power generation in high temperature scenarios. At the end of year 25, the power degradation of PERC modules is 12.86% (1.6% 11.26%), while that of TOPCon modules is 10.6% (0.6% 10%) and that of the HJT modules is 7.87% (1.6% 6.27%); the operating temperature loss of PERC modules is 8.31%, while that of TOPCon modules is 7.26% and that of HJT modules is 5.81%, as Figure 3.2 shows.
Figure 3.2 Comparison of the main losses of PERC/TOPCon/HJT at high temperature
The above analysis shows that in low temperature application scenarios, module power degradation is one of the main factors affecting product power generation; and in high temperature application scenarios, operating temperature is another important factor. Due to the extremely stable temperature coefficient, higher bifacial factor, and higher power retention of HJT modules, the power generation advantage of HJT is evident in high temperature areas, and in low temperature areas, HJT it also shows relatively high power generation gain, which will bring higher power generation gain and more stable power performance to PV system.
Photo - linkPhoto - linkPhoto - linkPhoto - linkPhoto - linkPhoto - linkPhoto - linkPhoto - linkPhoto - link
View original content: enlace